pacman::p_load(tidyverse)Hands-on Exercise 1: A Layered Grammar of Graphics: ggplot2 methods
1 Getting Started
1.1 Install and launching R packages
The code chunk below uses p_load() of pacman package to check if tidyverse packages are installed in the computer. If they are, then they will be launched into R.
1.2 Importing the data
exam_data <- read_csv("../../data/Exam_data.csv")Rows: 322 Columns: 7
── Column specification ────────────────────────────────────────────────────────
Delimiter: ","
chr (4): ID, CLASS, GENDER, RACE
dbl (3): ENGLISH, MATHS, SCIENCE
ℹ Use `spec()` to retrieve the full column specification for this data.
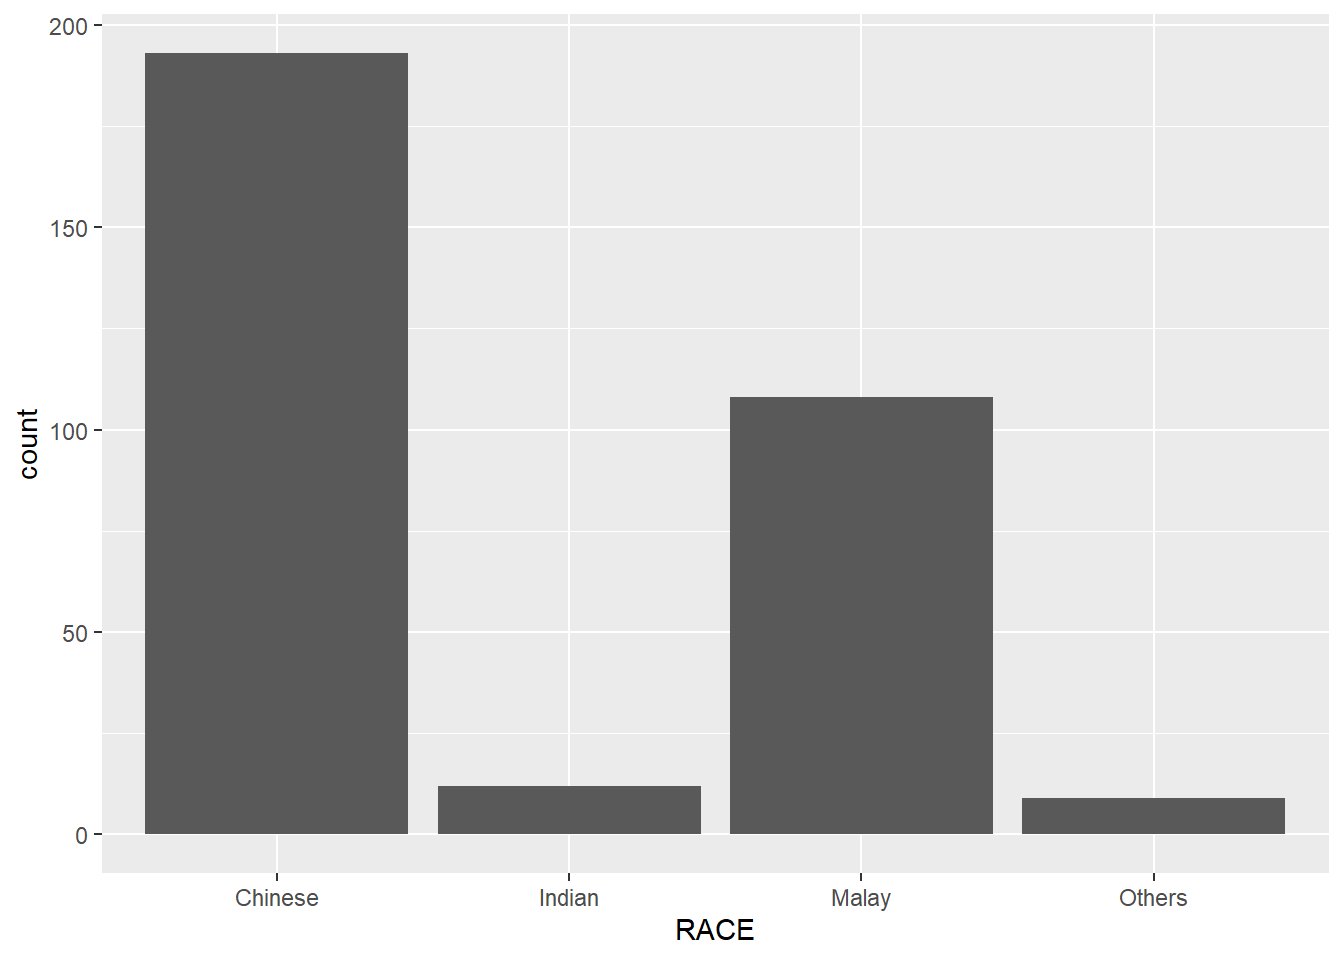
ℹ Specify the column types or set `show_col_types = FALSE` to quiet this message.2 Plotting a simple bar chart
ggplot(data = exam_data,
       aes(x = RACE)) +
  geom_bar()