In-class Exercise 3: Interactivity in Visual Analytics

Published

January 27, 2024

Modified

January 27, 2024

1 Short Quiz

  • Critic Figure 5.

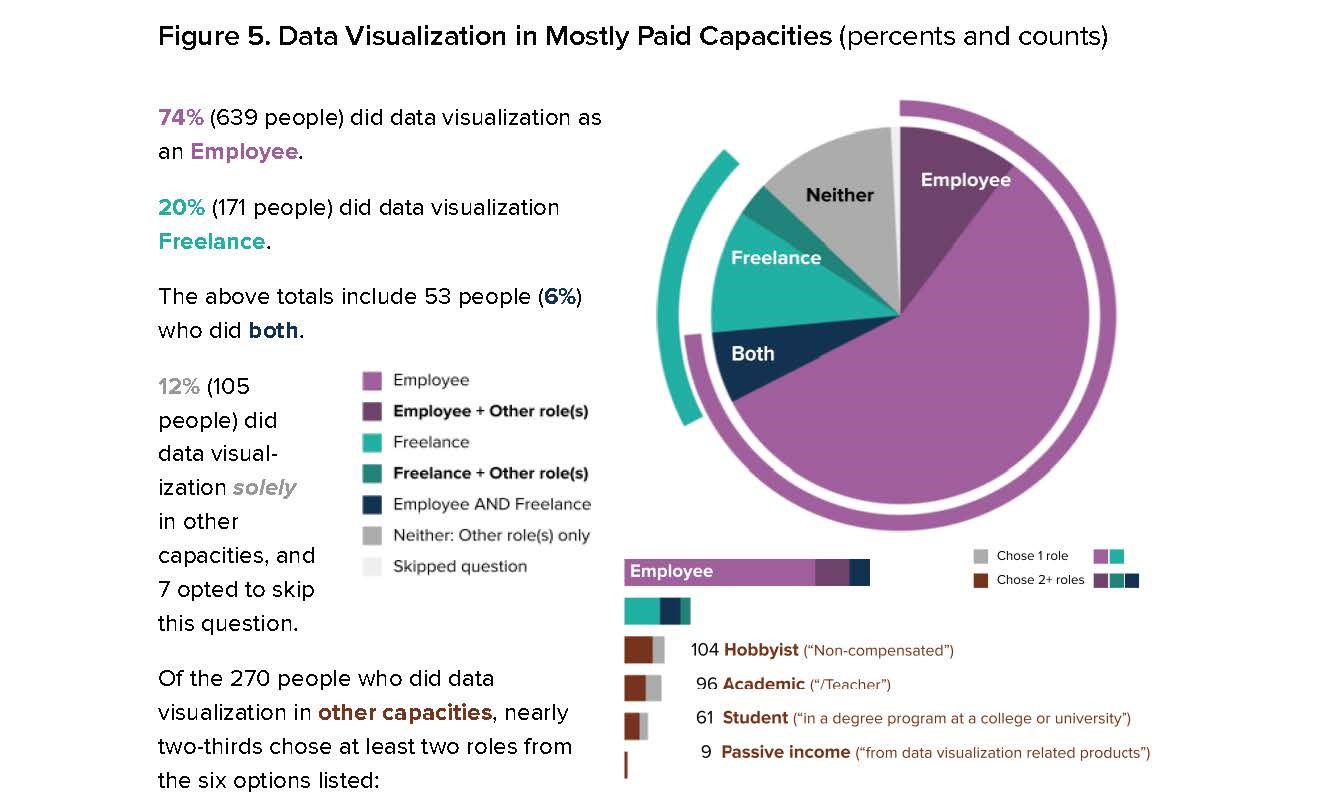
Click “here” to view the description of figure 5.

2 Tableau

Learning how to create interactive reports and storytelling with Tableau.